
Severity levels
As defined in RFC 5424, there are eight severity levels:
| Code | Severity | Keyword | Description | General Description |
|---|---|---|---|---|
| Emergency | emerg (panic) | System is unusable. | A «panic» condition usually affecting multiple apps/servers/sites. At this level it would usually notify all tech staff on call. | |
| 1 | Alert | alert | Action must be taken immediately. | Should be corrected immediately, therefore notify staff who can fix the problem. An example would be the loss of a primary ISP connection. |
| 2 | Critical | crit | Critical conditions. | Should be corrected immediately, but indicates failure in a primary system, an example is a loss of a backup ISP connection. |
| 3 | Error | err (error) | Error conditions. | Non-urgent failures, these should be relayed to developers or admins; each item must be resolved within a given time. |
| 4 | Warning | warning (warn) | Warning conditions. | Warning messages, not an error, but indication that an error will occur if action is not taken, e.g. file system 85% full — each item must be resolved within a given time. |
| 5 | Notice | notice | Normal but significant condition. | Events that are unusual but not error conditions — might be summarized in an email to developers or admins to spot potential problems — no immediate action required. |
| 6 | Informational | info | Informational messages. | Normal operational messages — may be harvested for reporting, measuring throughput, etc. — no action required. |
| 7 | Debug | debug | Debug-level messages. | Info useful to developers for debugging the application, not useful during operations. |
Tip: A common mnemonic used to remember the syslog levels in reverse order: «Do I Notice When Evenings Come Around Early».
Configure a log client
I will start this section by configuring a basic Linux server to forward its log files to the log host server configured earlier. This configuration is quite a bit shorter. Don’t forget to back up the original file.
Open the configuration file with your favorite editor (I prefer Vim, but whatever works for you is fine). Move to the Rules section and create a new line before any other entries. To be clear, you are adding this line before the facility.severity entries. Doing so allows all matches to be forwarded to the destination server.
Add the following information, where IP is the IP address of the log host server:
Note: If you’re using TCP, the syntax is *.* @@IP
Save your changes to the configuration file, and then restart the service:
Test the configuration
The command is used to manually create a log file entry. Run the following command to generate an entry:
Verify the log file entry by using the command to display the most recent entries in the log on the local server:
You should see the Test message.
Next, switch to the log host server, and then display the contents of :
You should see a directory named for the remote server you configured. If you the contents of that directory, you should see logs forwarded from the server. You can use the command to display the contents of the logs in this server’s subdirectory. You should see the Test message repeated here, too.
Configure your remaining servers
At this point, you can configure your remaining Linux servers to forward their logs to the log host. You could distribute a new version of the file by using rsync, SSH, or even set the configuration with Ansible.
Как происходит логирование?
Все программы Linux ведут лог путем отправки сообщений об ошибках или своем состоянии с помощью сокета syslog или просто записывая все сообщения в файл, который будет находиться в каталоге /var/log/.
Но важное значение имеет уровень подробности логирования. Вы можете настраивать подробность в каждой отдельной программе, или же с помощью syslog
Это поможет уменьшить использование дискового пространства, на хранение логов.
Но тут нужно найти компромисс между количеством информации и использованием диска. Например, ядро Linux определяет такие уровни логов, или как мы будем называть их ниже — приоритеты:
- KERN_EMERG — система неработоспособна;
- KERN_ALERT — нужно немедленно принять меры;
- KERN_CRIT — критическая ошибка;
- KERN_ERR — обычная ошибка;
- KERN_WARNING — предупреждение;
- KERN_NOTICE — замечание;
- KERN_INFO — информационное сообщение;
- KERN_DEBUG — сообщения отладки.
Подобные уровни лога поддерживаются в большинстве программ, которые ведут логи.
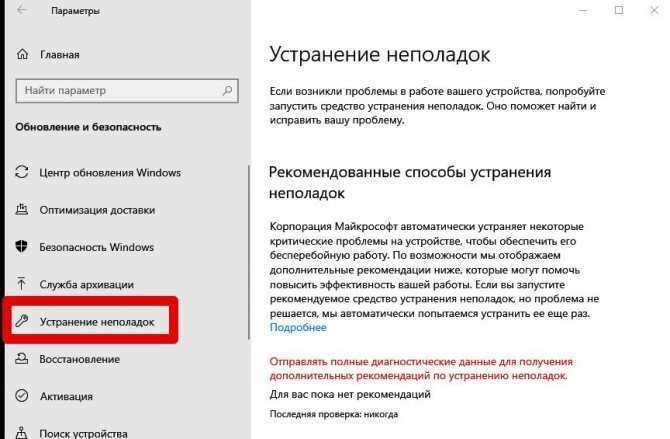
Измените параметры запуска для Службы оркестратора обновлений.
Служба оркестратора обновлений (Update Orchestrator Service) считается очень важной служба для правильной работы процессов обновления. По умолчанию эта служба должна быть установлена на автоматический запуск, однако бывают случаи, когда она отключена у пользователей по необоснованным причинам
Итак, давайте проверим, настроена ли Служба оркестратора обновлений правильно:
- Нажмите Windows Key + R, скопируйте и вставьте и нажмите Enter.
- Затем найдите Служба оркестратора обновлений среди списка.
- Далее дважды щелкните по нейи перейдите в Общие меню.
- Установите Тип запуска на Автоматически.
- Наконец, нажмите Применить, закройте окно, перезагрузите компьютер, и посмотрите решилась ли проблема.
Coexistence with systemd
Rsyslog should by default be configured for systemd support on all platforms
that usually run systemd (which means most Linux distributions, but not, for
example, Solaris).
Rsyslog is able to coexist with systemd with minimal changes on the part of the
local system administrator. While the now assumes full
control of the local system log socket, systemd provides
access to logging data via the log socket.
This log socket is provided by the file that is shipped
with systemd.
The imuxsock module can still be used in this setup and provides superior
performance over imjournal, the alternative journal input
module.
Note
It must be noted, however, that the journal tends to drop messages
when it becomes busy instead of forwarding them to the system log socket.
This is because the journal uses an async log socket interface for forwarding
instead of the traditional synchronous one.


New in version 8.32.0: rsyslog emits an informational message noting the system log socket provided
by systemd.
See also
Настройка Cisco для Syslog
as53xx231#conf t
Enter configuration commands, one per line.  End with CNTL/Z.
as53xx231(config)#logging trap ?
  <0-7>          Logging severity level
  alerts         Immediate action needed           (severity=1)
  critical       Critical conditions               (severity=2)
  debugging      Debugging messages                (severity=7)
  emergencies    System is unusable                (severity=0)
  errors         Error conditions                  (severity=3)
  informational  Informational messages            (severity=6)
  notifications  Normal but significant conditions (severity=5)
  warnings       Warning conditions                (severity=4)
as53xx231(config)#logging trap debugging
as53xx231(config)#logging facility local2
as53xx231(config)#logging 10.26.95.254
as53xx231(config)#exit
- logging trap debugging — (Использование syslog server logging level) задаем уровень подробности логов.
- local2 — (Facility parameter for Использование syslog messages). Предварительно нужно проверить на FreeBSD свободен ли local2, если занят, то можно использовать любой с local1 по local7.
- 10.26.95.254 — сервер, на котором настроен Использование syslog для принятия сообщений от cisco.
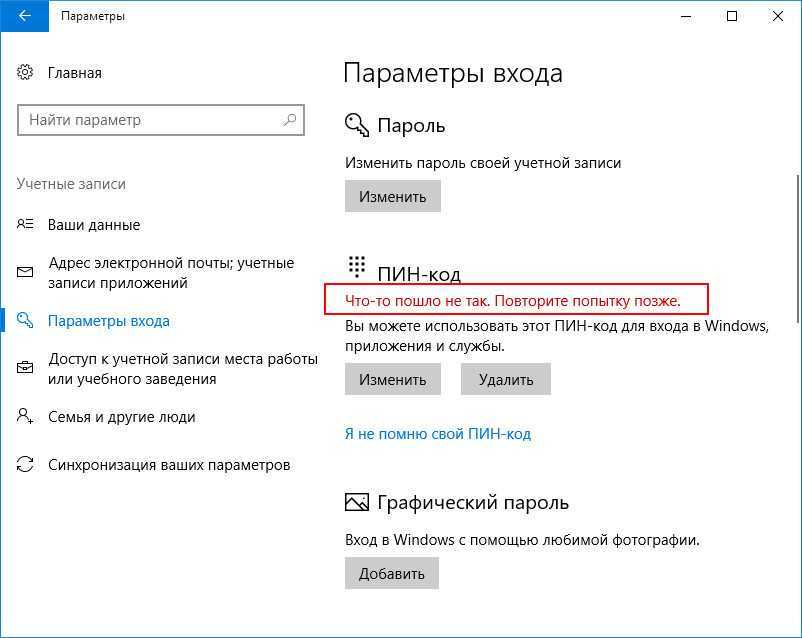
Создайте новую локальную учетную запись.
Если ни один из упомянутых шагов не помог вам решить проблему, тогда стоит попробовать создать новую учетную запись пользователя. Иногда вновь созданные аккаунты могут решить проблемы с настройками и вернуть некоторые службы в нормальный строй
Также обратите внимание, что новые учетные записи не содержат данных, которые хранились ранее, поэтому не забудьте переместить туда свои файлы. Если новая учетная запись помогла вам решить проблему, вы можете оставить или удалить исходную после перемещения всех важных данных
Ниже вы можете найти шаги для создания новой учетной записи:
- Щелкните правой кнопкой мыши на папку Меню Пуск и выберите Параметры. Вы также можете нажать Windows Key + I сочетание клавиш.
- Войдите в Учетные записи > Семья и другие пользователи.
- На правой панели прокрутите вниз до Другие пользователи раздела и нажмите Добавить пользователя для этого компьютера.
- Теперь выберите У меня нет данных для входа этого человека внизу.
- Выберите Добавить пользователя без учетной записи Майкрософт внизу.
- Затем введите имя пользователя и пароль для нового пользователя и нажмите Следующая.
- Теперь вы можете переключиться на новую учетную запись (щелкнув на значок пользователя в Меню Пуск) и попробуйте снова открыть Центр обновлений.
Verify the logs
After the configuration is completed on the client machine, we want to verify that everything went well.
Go to your Rsyslog server to verify the logs from your client machine:
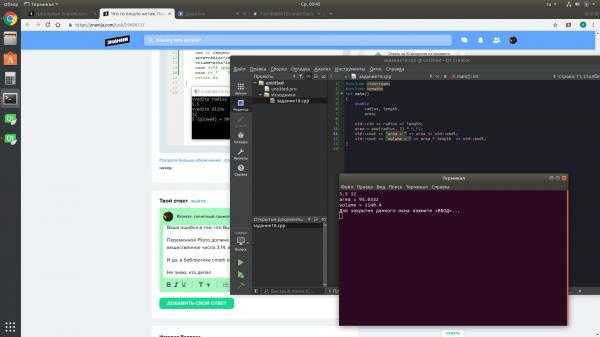
You will find something like this:
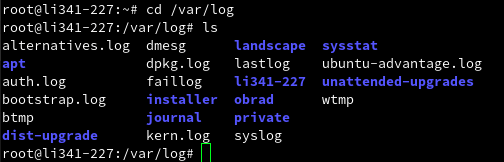
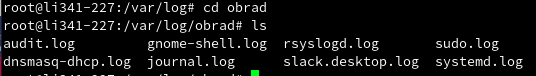
List /var/log
In my case directory named obrad is the name of my client machine which I am currently using. We will enter this directory and see something like this:
List var/log/hostname
You should see all log files generated by Rsyslog.
You can check any of these logs with the following command: Let’s for example inspect systemd.log.
And you will see something like this:
As you can see I launched terminal and gedit text edit on my client machine and Rsyslog generated and display this in output.
Приоритет сообщений в логах
Как rsyslog так и joirnald имеют одну общую штуку, касающуюся ведения логов. Это приоритет сообщений. Логи в системе генерируются в зависимости от типа события, а это событие, в свою очередь, имеет определенную степень критичности. Вот в зависимости от этой критичности, событию присваивается определенный приоритет. Знать типы приоритетов, совсем не лишнее, будет немного проще разбирать логи Linux.
Типы приоритетов:
emerg — наивысший приоритет, что-то сломалось, повод паниковать;
alert — тревога, стоит волноваться;
crit — критическое событие, нужно насторожиться;
err — ошибка, надо напрячься;
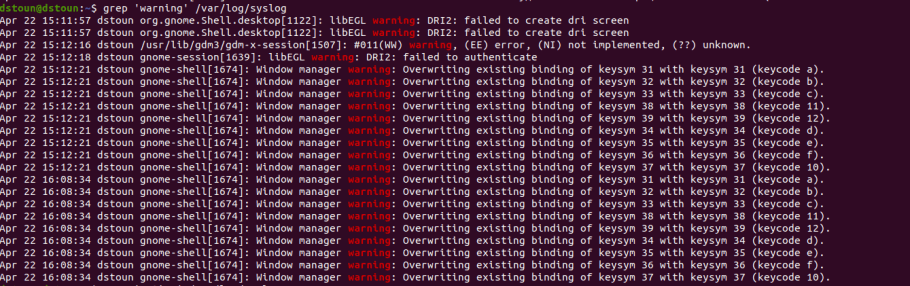
warning — внимание, нужно не терять бдительность;
notice — уведомление, можно не заморачиваться;
info — информационное сообщение, принять к сведению и забыть;
debug — отладочная информация, вообще пофиг;
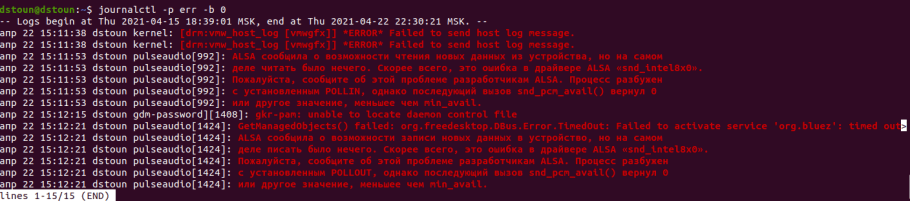
Мы можем использовать их для просмотра логов, фильтруя информацию по конкретному приоритету.
Например:
Или в случае с journalctl:
Ну, а на этом наше знакомство с логами можно считать оконченным. Мы конечно рассмотрели здесь только самые важные моменты, но на то оно и знакомство, что бы узнать азы, а глубже уже изучать самостоятельно. Если в этом есть необходимость, конечно. Потому что, описанного в этой статье, как по мне, вполне достаточно обычному пользователю, чтобы комфортно чувствовать себя при работе с логами. Ну и свой баф к линуксоидности ты сегодня получил. Потому не забывай возвращаться к нам, ведь есть ещё много тем которые стоит изучить.
Твой Pulse.
Некоторые типсы и триксы для rsyslog
Иногда, когда rsyslog является сетевым сервисом для сбора удаленных логов, хранение сообщений по имени хоста неудобно или непроизводительно или может еще что-то. Чтобы отключить резолвинг ip адресов в хостнеймы, необходимо добавить параметр -x:
~ # cat /etc/default/rsyslog
RSYSLOGD_OPTIONS="-c5 -x"
Для того чтобы разрешить в нетфильтре прохождение udp пакетов, необходимо использовать команду:
~ # iptables -A INPUT -p udp -s подсеть_источник --dport 514 -i интерфейс -j ACCEPT
Некоторые примеры правил с комментариями:
# если создаете селектор вот такого типа:
if $fromhost-ip startswith ‘10.0.1.’ then /что/то
# стоит обратить внимание на последнюю точку в адресе,
# иначе под правило подпадут адреса из подсети 10.0.111.0, 10.0.12.0 и другие
Для централизованного сервера сбора логов с сетевых устройств, можно на сетевых устройствах установить источник (facility) в какое-либо значение из local0-local7. Это позволит удобно сортировать сообщения, пример:
# cisco:
net-device-cisco#conf t
Enter configuration commands, one per line.  End with CNTL/Z.
<...>
net-device-cisco(config)#logging facility local2
<...>
# rsyslog-server
local2.*     /var/log/remote-cisco.log
& ~
Таким образом, можно удобно фильтровать локальные сообщения от удаленных.
Вот некоторый конфиг, который позволяет отправлять почтовые уведомления о событиях (!!! почтовый сервер должен принимать сообщения без аутентификации):
$ModLoad ommail
$ActionMailSMTPServer адрес_smtp
$ActionMailSMTPPort 25
$ActionMailFrom адрес@отправителя
$ActionMailTo адрес@получателя
$template mail_subject,"On host %hostname%, Error-level by serverity"
$template mail_body,"Facility.Serverity: %syslogfacility%.%syslogpriority% at %timegenerated% on host: %HOSTNAME%\r\n %msg%"
$ActionMailSubject mail_subject
# интервал времени (пауза между письмами)
$ActionExecOnlyOnceEveryInterval 10
# фильтр отбора и действие
if     not ($msg contains 'что_то'\
         or $msg contains 'еще_что_то'\
         or $msg contains 'может_еще_что_то' )\
       and ($syslogseverity-text =='err'\
         or $syslogseverity-text =='crit'\
         or $syslogseverity-text =='alert'\
         or $syslogseverity-text =='emerg' )\
then :ommail:;mail_body
Траблешуттинг
Для диагностики работы syslog отлично помогает tcpdump, пример команды для мониторинга:
~ # tcpdump -vvv -nn -i интерфейс udp port 514
Ну и, конечно же сам /var/log/syslog.
Что еще почитать
https://www.suse.com/releasenotes/x86_64/SUSE-SLES/11-SP2/ — rsyslog внедряется в SuSe
http://www.debian.org/releases/lenny/i386/release-notes/ch-whats-new.en.html#system-changes — rsyslog внедряется в Debian
https://access.redhat.com/knowledge/docs/en-US/Red_Hat_Enterprise_Linux/5/html-single/5.2_Release_Notes/index.html#sect-Red_Hat_Enterprise_Linux-Release_Notes-Feature_Updates — rsyslog внедряется в RedHat
http://www.bog.pp.ru/work/syslog.html#linux — очень много русифицированных параметров и директив
http://www.rsyslog.com/doc — документация от разработчика
http://www.rsyslog.com/doc/rsyslog_conf_modules.html — модули rsyslog
http://tools.ietf.org/html/rfc3164 — RFC syslog
http://wiki.rsyslog.com/index.php/Configuration_Samples — примеры конфигураций
http://www.rsyslog.com/tag/more-complex-scenarios/ — многие примеры брал отсюда
http://www.rsyslog.com/doc/property_replacer.html — переменные в конфиге, такие как hostname $year …


![Как лог cisco выводить в syslog [айти бубен]](https://smartshop124.ru/wp-content/uploads/3/2/4/324a87ced3a6dc54bcc90d407c39dca6.jpeg)
Резюме
Статья получилась мега большая. В перспективе, наверно разделю ее на 2 более подробные… В целом, думаю, что прочитав материал — удастся получить достаточный объем базового понимания принципов работы rsyslog, чтобы реализовать своё более сложное и интересное решение. До новых статей!
Понимание логирования
- Прямая запись: некоторые сервисы записывают информацию напрямую в лог-файлы, даже некоторые важные сервисы, такие как веб-сервер Apache и файловый сервер Samba.
- rsyslogd: rsyslogd — это усовершенствование сервиса syslogd, который занимается централизованным управлением лог-файлов. Syslogd существует уже давно.
- journald: с введением systemd также был представлен сервис логирования journald. Этот сервис тесно интегрирован с systemd, что позволяет администраторам читать подробную информацию из journald, одновременно отслеживая состояние сервиса с помощью команды systemctl status.
Step 4 — Viewing Rotating Log Files
The size of log files must be controlled because it keeps growing over time. Each system has limited resources, and too large logs lead to performance and memory problems. Linux solves this problem with a concept called rotating logs. Rotation continuously repeats the following actions:
- Instead of deleting the log file, Linux changes the file name to a name with a version suffix and creates a new one. The log file has multiple old back-ups. Optionally, these backups are compressed.
- When the count of backup files reaches a specified number, the system deletes the oldest.
Let’s view an example of Linux rotating files. Execute command with following options:
The option formats the output in a long listing including various metadata. The option prints file in a human-readable form, and the option sorts the output listing by modification time (newest first). The parameter specifies to view all files at directory that starts with prefix .
You’ll see the program’s output appear on the screen:
The output shows all version of . Typically, it is the biggest log file because as explained earlier, this log stores basically every event of the system. The older versions are labelled with version suffix (e.g. is the oldest syslog backup).
You can see that the backups are compressed (the suffix means that the file is compressed by the standard GNU zip compression algorithm). As you can observe, these files grow to the size of gigabytes (in our example the biggest is 3.5 GB large). At last, you can view that these files cover only a time interval of six days.
Установка и настройка MySQL
— Устанавливаем Percona Server по инструкции разработчика:
— Перезагружаем сервер:
sudo reboot
— Настраиваем Percona Server:
sudo cp /etc/mysql/my.cnf /etc/mysql/my.cnf_old
sudo cp /etc/mysql/percona-server.conf.d/mysqld.cnf /etc/mysql/my.cnf
sudo nano /etc/mysql/my.cnf
— Содержание /etc/mysql/my.cnf для сервера с 6Gb ОЗУ:
user = mysql
pid-file = /var/run/mysqld/mysqld.pid
socket = /var/run/mysqld/mysqld.sock

# PATHS
basedir = /usr
datadir = /var/lib/mysql
tmpdir = /dev/shm
lc-messages-dir = /usr/share/mysql
explicit_defaults_for_timestamp

local-infile = 0

# NETWORK
bind-address = 127.0.0.1
port = 3306
connect_timeout = 60
wait_timeout = 28800
max_connections = 2048
max_allowed_packet = 64M
max_connect_errors = 1000

# LOGS
log_error = /var/log/mysql/error.log
slow_query_log_file = /var/log/mysql/slow.log
slow_query_log = 1
long_query_time = 20

# Recommended in standard MySQL setup
sql_mode=NO_ENGINE_SUBSTITUTION,STRICT_ALL_TABLES

# Disabling symbolic-links is recommended to prevent assorted security risks
symbolic-links=0

# limits
tmp_table_size = 256M
max_heap_table_size = 128M

# innodb
innodb_data_home_dir = /var/lib/mysql
innodb_file_per_table = 1
innodb_status_file = 1
innodb_buffer_pool_size = 4G
innodb_buffer_pool_instances = 8
innodb_flush_method = O_DIRECT
innodb_io_capacity = 800
innodb_flush_log_at_trx_commit = 0
innodb_support_xa = ON
innodb_log_file_size = 128M
innodb_log_buffer_size = 64M

# other stuff
sync_binlog = 0
event_scheduler = 1
query_cache_type = 0
query_cache_size = 0
— Применяем настройки:
sudo service mysql restart
Setup Rsyslog Centralized Log Server on Ubuntu 20.04
After a brief overview, what are logs, Syslog, and where rsyslog has a place, let us move on to the configuration process itself.
Prerequisites
- Two servers that running Ubuntu 20.04
- A static IP address: example 192.168.0.101 is needed to be configured on Rsyslog server machine and 192.168.0.102 is configured on Rsyslog client machine
Ubuntu 20.04 system has rsyslog installed by default which came with standard system packages.
You can check to see if it is running:
Run the following command to check the Rsyslog version which is currently installed:
Output:
In case not installed or running, install rsyslog using the following commands:
Now it’s time to go to rsyslog.conf file, to uncomment and change some lines to run rsyslog service in server mode:
Uncomment these four lines that enable udp and tcp port binding:
The next step that we are gonna need to add is to create a new template. We need to create a new template for receiving remote messages. A template will give instructions to rsyslog server about how to store incoming syslog messages.
NOTE: Add template right before GLOBAL DIRECTIVES section:
The above line indicates that received logs will be processed and stored inside directory /var/log/. You can define in /etc/rsyslog.conf file where to rsyslog logs.
The file name contains %HOSTNAME% and %PROGRAMNAME% variables stand for client machine and client program name that produced the log message.
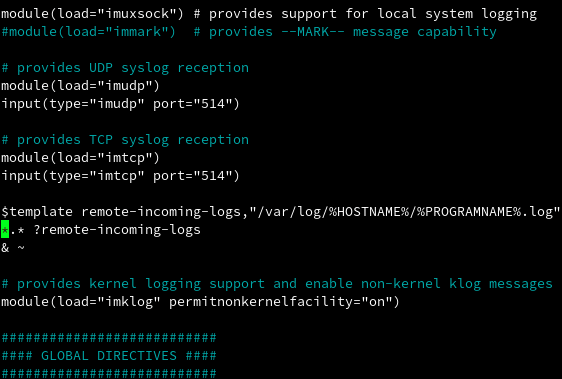
Configuration file for Rsyslog
Save this and than restart rsyslog service:
Confirme that rsyslog service is listening on configured ports:
If you maybe have ufw firewall service, you need to allow rsyslog firewall port rules:
To verify configuration, run the following command:
Подготовка сервера
На сервере нужно, предварительно, выполнить следующие настройки.
Время
Для правильной фиксации времени логов, необходимо настроить его синхронизацию.
Сначала задаем правильный часовой пояс:
\cp /usr/share/zoneinfo/Europe/Moscow /etc/localtime
* в данном примере мы использовали московское время.
Затем устанавливаем и запускаем chrony.
а) на системе CentOS / Red Hat:
yum install chrony
systemctl enable chronyd
systemctl start chronyd
б) на системе Ubuntu / Debian:
apt-get install chrony
systemctl enable chrony
systemctl start chrony
Брандмауэр
Если используется брандмауэр, необходимо открыть порты TCP/UDP 514.
а) с помощью firewalld:
firewall-cmd —permanent —add-port=514/{tcp,udp}
firewall-cmd —reload
б) с помощью iptables:
iptables -A INPUT -p tcp —dport 514 -j ACCEPT
iptables -A INPUT -p udp —dport 514 -j ACCEPT
в) с помощью ufw:
ufw allow 514/tcp
ufw allow 514/udp
ufw reload
SELinux
Проверяем, работает ли в нашей системе SELinux:
getenforce
Если мы получаем в ответ:
Enforcing
… необходимо либо настроить SELinux:


![Как лог cisco выводить в syslog [айти бубен]](https://smartshop124.ru/wp-content/uploads/3/3/e/33e15951fa435a4f935569d12113e090.jpeg)

semanage port -m -t syslogd_port_t -p tcp 514
semanage port -m -t syslogd_port_t -p udp 514
… либо отключить его командами:
setenforce 0
sed -i ‘s/^SELINUX=.*/SELINUX=disabled/g’ /etc/selinux/config
Запуск демона syslogd
Запуск демона протоколирования запускаются на этапе инициализации системы посредством скрипта /etc/rc.d/init.d/syslog, однако для того, чтобы задать параметры запуска, нет необходимости корректировать этот скрипт — начиная с версии 7.2, опции запуска считываются из отдельного конфигурационного файла /etc/sysconfig/syslog (/etc/default/syslog в debian).
Вот некоторые возможные параметры запуска демона syslogd:
- -a /folder/socket — указание дополнительного слушающего сокета (не забудьте предварительно создать сокет)
- -d — отладочный режим. При этом демон не переходит в фоновый режим и выдает все сообщения на текущий терминал;
- -f имя-конфигурационного-файла. Задает имя альтернативного конфигурационного файла, который будет использоваться вместо заданного по умолчанию /etc/syslog.conf;
- -l список-хостов — задание списка хостов, имена которых не должны записываться с указанием полного доменного имени (FQDN — Full Qwalified Domain Name);
- -m минут — запущенный без этой опции sysklogd через каждые 20 минут записывает в протокол сообщения категории mark (временные отметки). С помощью опции -m можно либо изменить интервал между отметками, либо вовсе отменить выдачу таких сообщений;
- -p socket — задание альтернативного сокета UNIX (вместо прослушиваемого по умолчанию /dev/log);
- -r — разрешение принимать сообщения от удаленных хостов;
- -x — запрет определения имени хоста по его адресу для предотвращения зависания при работе на одном хосте с сервером DNS.
- -v — показать версию и закончить работу
После запуска демона syslogd создается файл статуса /var/lock/subsys/syslog нулевой длины, и файл с идентификационным номером процесса /var/run/syslogd.pid.
С помощью командыkill -SIGNAL `cat /var/run/syslogd.pid`
можно послать демону syslogd один из следующих сигналов: SIGHUP — перезапуск демона; SIGTERM — завершение работы; SIGUSR1 — включить/выключить режим отладки.
Вообще-то в системе запускаются два демона протоколирования — syslogd и klogd. Оба демона входят в состав пакета sysklogd.
Демон klogd отвечает за журналирование событий, происходящих в ядре системы. Необходимость в отдельном демоне klogd объясняется тем, что ядро не может использовать стандартную функцию syslog. Дело в том, что стандартные библиотеки С (включая ту библиотеку, в которой находится функция syslog) предназначены для использования только обычными приложениями. Поскольку ядро тоже нуждается в функциях журналирования, в него включены свои библиотеки, недоступные приложениям. Поэтому ядро использует свой собственный механизм генерации сообщений.
Демон klogd предназначен для организации обработки этих сообщений. В принципе он может производить такую обработку полностью самостоятельно и независимо от syslogd, например, записывая эти сообщения в файл, но в большинстве случаев используется принятая по умолчанию настройка klogd, при которой все сообщения от ядра пересылаются тому же демону syslogd.
syslogd daemon
This daemon starts with systems and runs in the background all the time, capturing system events and logging them in Syslog. It can be started, stop, restart like other services operations in Linux. You need to check which Syslog version (three projects as stated above) is running () and accordingly, use the daemon name.
# service rsyslog status
rsyslogd (pid  999) is running...

# service rsyslog restart
Shutting down system logger:
Starting system logger:
After making any changes in the configuration file you need to restart in order to take these new changes in effect.
syslog configuration file
As stated above is a configuration file where you can define when, where, which event to be logged by Syslog daemon. There name changes as per your Syslog version
- for syslog
- for syslog-ng
- for rsyslog
The typical config file looks like below :
*.info;mail.none;authpriv.none;cron.none                /var/log/messages
authpriv.*                                              /var/log/secure
mail.*                                                  -/var/log/maillog
cron.*                                                  /var/log/cron
*.emerg                                                 *
uucp,news.crit                                          /var/log/spooler
local7.*                                                /var/log/boot.log
Here, on the left side column shows services for which you want logs to be logged along with their priority (succeeded by after service name) and on the right side are actions normally destinations where logs should be written by the daemon.
Services values and priorities :
- local7: boot messages
- kern: Kernel messages
- auth: Security events
- authpriv : Access control related messages
- mail, cron: mail and cron related events
Service priorities :
- debug
- info
- notice
- warning
- err
- crit
- alert
- emerg
- * means all level of messages to be logged
- none means no messages to be logged
All the above priorities are given in ascending level of urgency.
Actions/destination :
Those mostly log files or remote Syslog server to which logs get sent. The remote server can be specified by IP or hostname preceded by @ sign.
Syslog
All logs by syslogd are written its Syslog file . Typical Syslog file looks like :
May 22 02:00:29 server1 rsyslogd: [origin software="rsyslogd" swVersion="5.8.10" x-pid="999" x-info="http://www.rsyslog.com"] exiting on signal 15.
May 22 02:00:29 server1 kernel: imklog 5.8.10, log source = /proc/kmsg started.
May 22 02:00:29 server1 rsyslogd: [origin software="rsyslogd" swVersion="5.8.10" x-pid="1698" x-info="http://www.rsyslog.com"] start
May 22 02:17:43 server1 dhclient: DHCPREQUEST on eth0 to 172.31.0.1 port 67 (xid=0x445faedb)
Here file can be read in below parts from left to right :
- Date
- Time
- Hostname (This is important to identify which server’s log is this on centralized Syslog server)
- The service name for which logs were written by the daemon
- Separator colon
- Actual message or log
The first 5 fields can be used for sorting, filtering logs in various tools, scripts, etc. Since Syslog logs, all events on system, it’s obvious it grows in size pretty quickly. You can manually rotate Syslog over a specific period or you can even use utility to do it automatically in the background.
Testing Syslog logging
To test if the daemon is logging messages in Syslog or not, you can use logger command. With this command, you can specify numerous options like a priority, service, etc. But even without any argument, you can supply a string to write in Syslog and it will do the job for you.
# logger Writing KERNELTALKS in syslog using logger. Testing...

# cat /var/log/messages |grep -i kerneltalks
May 22 02:31:05 server1 root: Writing KERNELTALKS in syslog using logger. Testing...
In the above example, you can see all entries after logger command are printed in the Syslog file. Since we used logger command and didn’t specify any service, it logged message with userid root in-service field!


![0x80244022 windows update error [solved] - driver easy](http://smartshop124.ru/wp-content/uploads/4/1/a/41a049c21fc817397ecefe79dd2dec4a.jpeg)

